

Read your analytics
Open Analytics in the page editor. The top row is the summary for whatever range you picked, and below it are the daily trend and the breakdowns — where visitors came from, what they were using and where in the world they were. Two numbers are worth your attention: click-through rate, and which referrer is actually sending people.
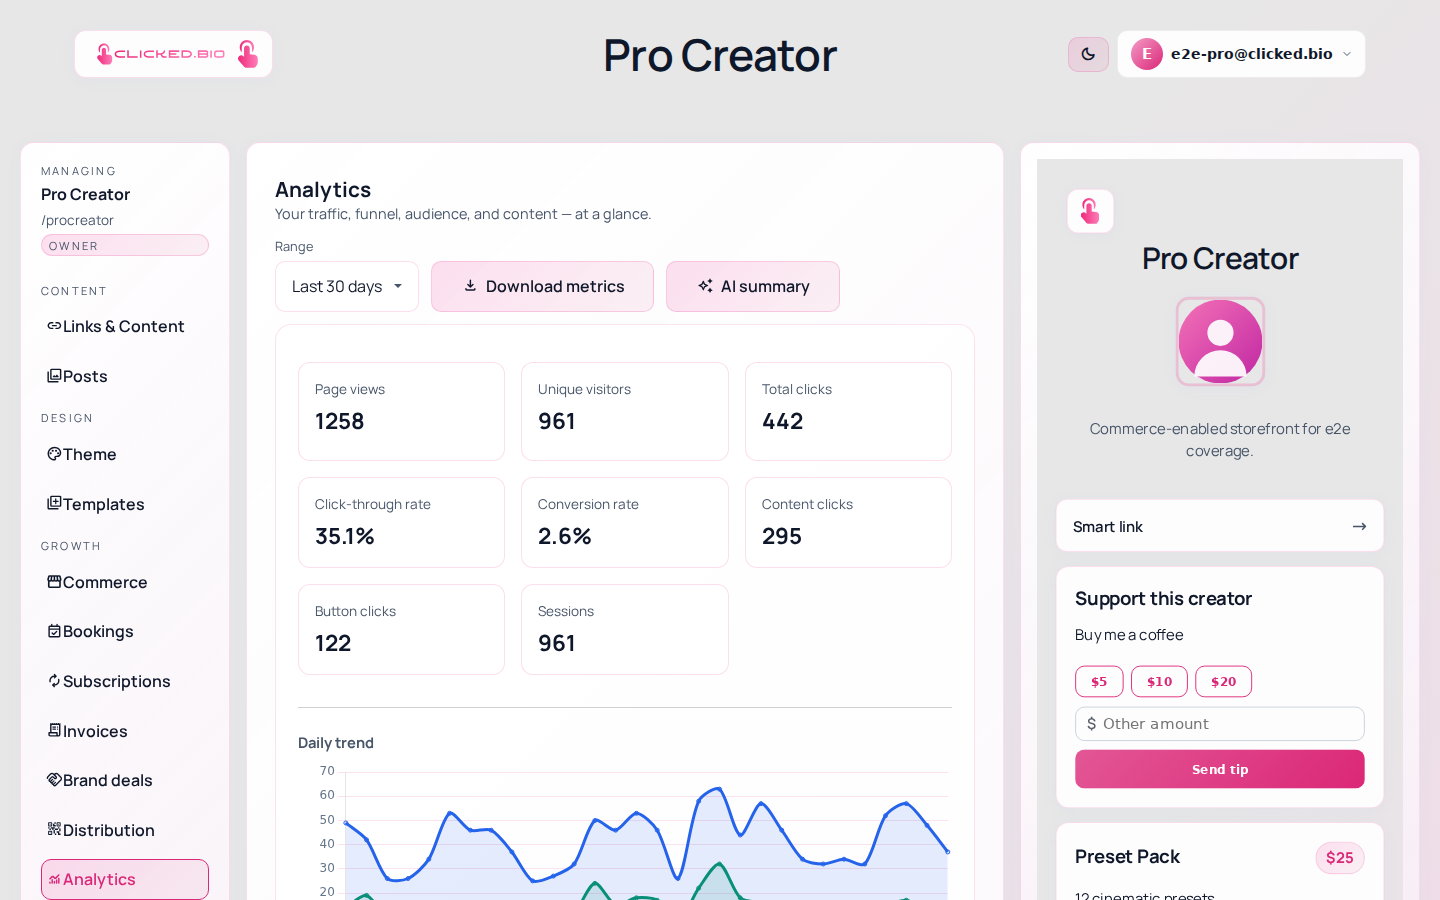
What each number means#
- Page views — times your page was loaded, including someone opening it twice.
- Unique visitors — how many distinct people that was. The gap between this and page views is your repeat traffic.
- Total clicks — every click on anything clickable.
- Click-through rate — the share of visitors who clicked something. This is the one that tells you whether the page is working.
- Conversion rate — the share who reached a goal you defined. It sits at zero until you set a goal.
- Content clicks and Button clicks — clicks on posts and blocks, against clicks on call-to-action buttons.
- Sessions — separate visits. One person coming back tomorrow is two sessions.
The number to act on#
Click-through rate. Anything under about 20% usually means the page has too many options rather than too little traffic.
The fix is boring and it works: cut the list, move the thing you actually want clicked to the top, and rewrite its label as an instruction. Then look again in a week.
Page views are the number that feels good and tells you least. It mostly reflects how much you posted.
Changing the range#
The Range dropdown sits above the summary. Compare like with like. A week that included a launch, set against a week that did not, tells you about the launch rather than about the page.
Referrers, devices and countries#
Below the trend chart are referrers, devices, browsers, operating systems and countries.
Referrers is the useful one. It shows which platform is sending people, which is worth knowing when you are posting the same link in four places and only one of them is doing anything.
Countries matters if you sell physical things or run live sessions, because it decides shipping and time zones. It also tells you whether it is worth routing visitors from different countries to different places, which links can do.
Export your analytics as CSV#
Download metrics gives you a CSV of the raw rows for the selected range, on every plan including Free. There is also an API, if you would rather pull it into a spreadsheet or a dashboard automatically.
How far back it goes#
Two different things are kept for two different lengths of time.
Detailed data is every individual visit, which is what you can open and export. It goes back 30 days on Free, 90 on Starter, 180 on Pro, and 365 on Agency and Enterprise.
Summary data is monthly totals and top breakdowns. That is kept indefinitely on every plan, so your year-on-year picture stays intact.
If you want to keep the raw detail beyond your window, export it while it is still inside the window. We cannot recreate it afterwards. Everything is stored in UTC and shown in your own time zone. The pricing page carries the current retention figures.
Across several pages#
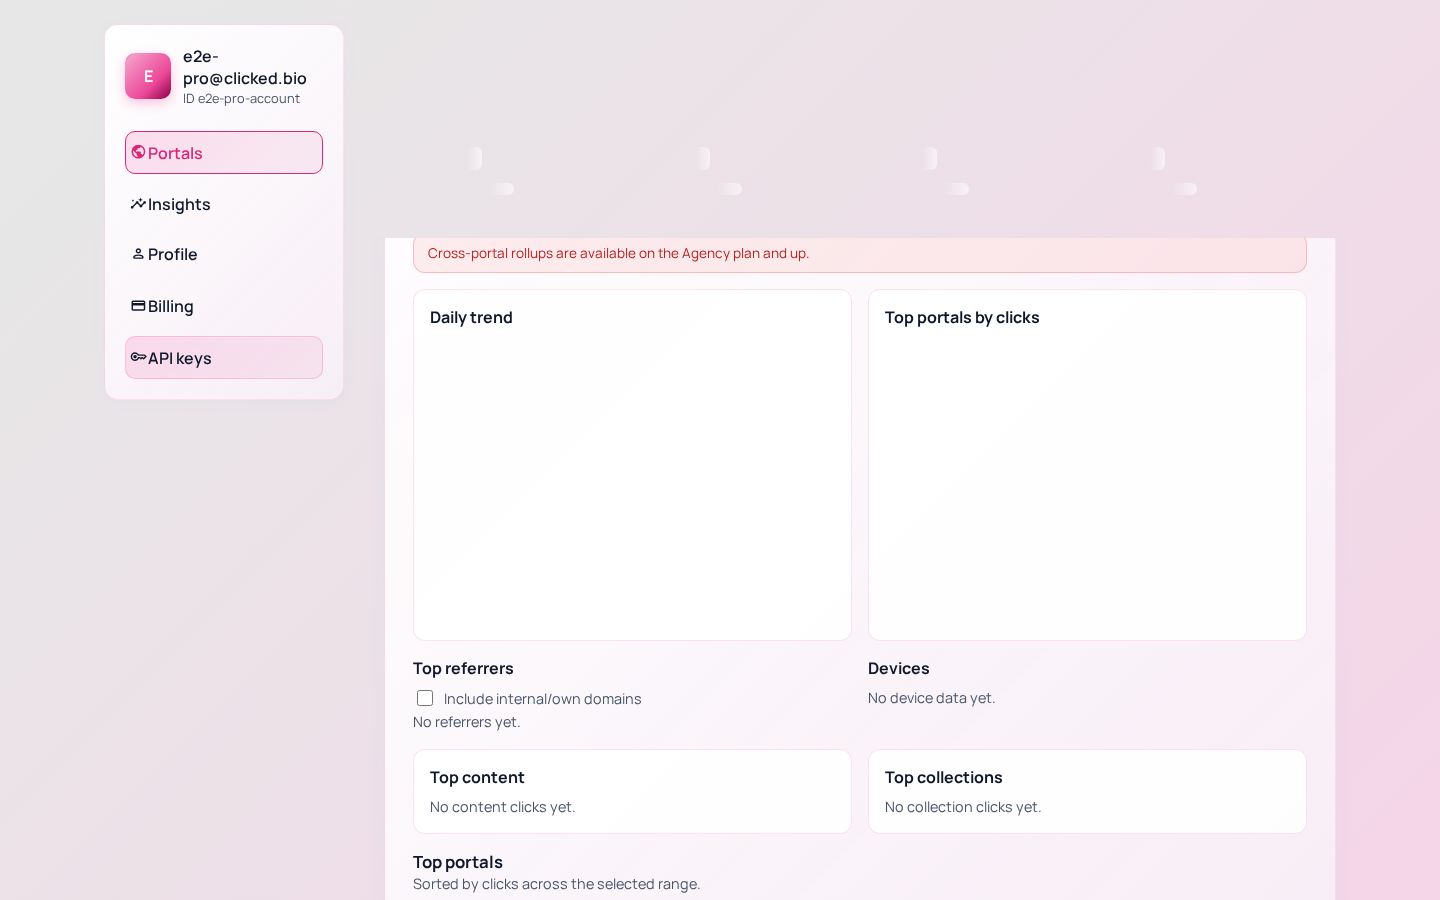
The Analytics panel covers one page. For a combined view, use Insights on your dashboard.
What we do not track#
Visitors who decline tracking are not tracked, and the consent banner is shown for you. Numbers therefore run slightly below reality, in the same way they do on any site that asks properly. We do not build a profile of your visitors, and we do not sell anything about them.
If something is not working#
- Everything reads zero Most likely the range. A new page with a "Last 30 days" range that started yesterday shows almost nothing.
- Conversion rate stays at 0% There is no goal defined. Conversion is measured against a goal you set under Conversion goals, on Pro and above.
- Your own visits are in the numbers They are. We do not filter you out. Bear it in mind on a quiet page where your own testing is a large share of the traffic.
- Clicks here do not match the destination's analytics They never will exactly. We count the click; the destination counts the arrival, and some people leave in between. Add UTM tags so at least the traffic is attributed to you.